About
Penguin Productions is a recording, production and mix studio located in the city of Aarhus, Denmark. The studio is run by producer, sound engineer and musician Esben Inglev, and is a part of the studio collective Lydhavnen.
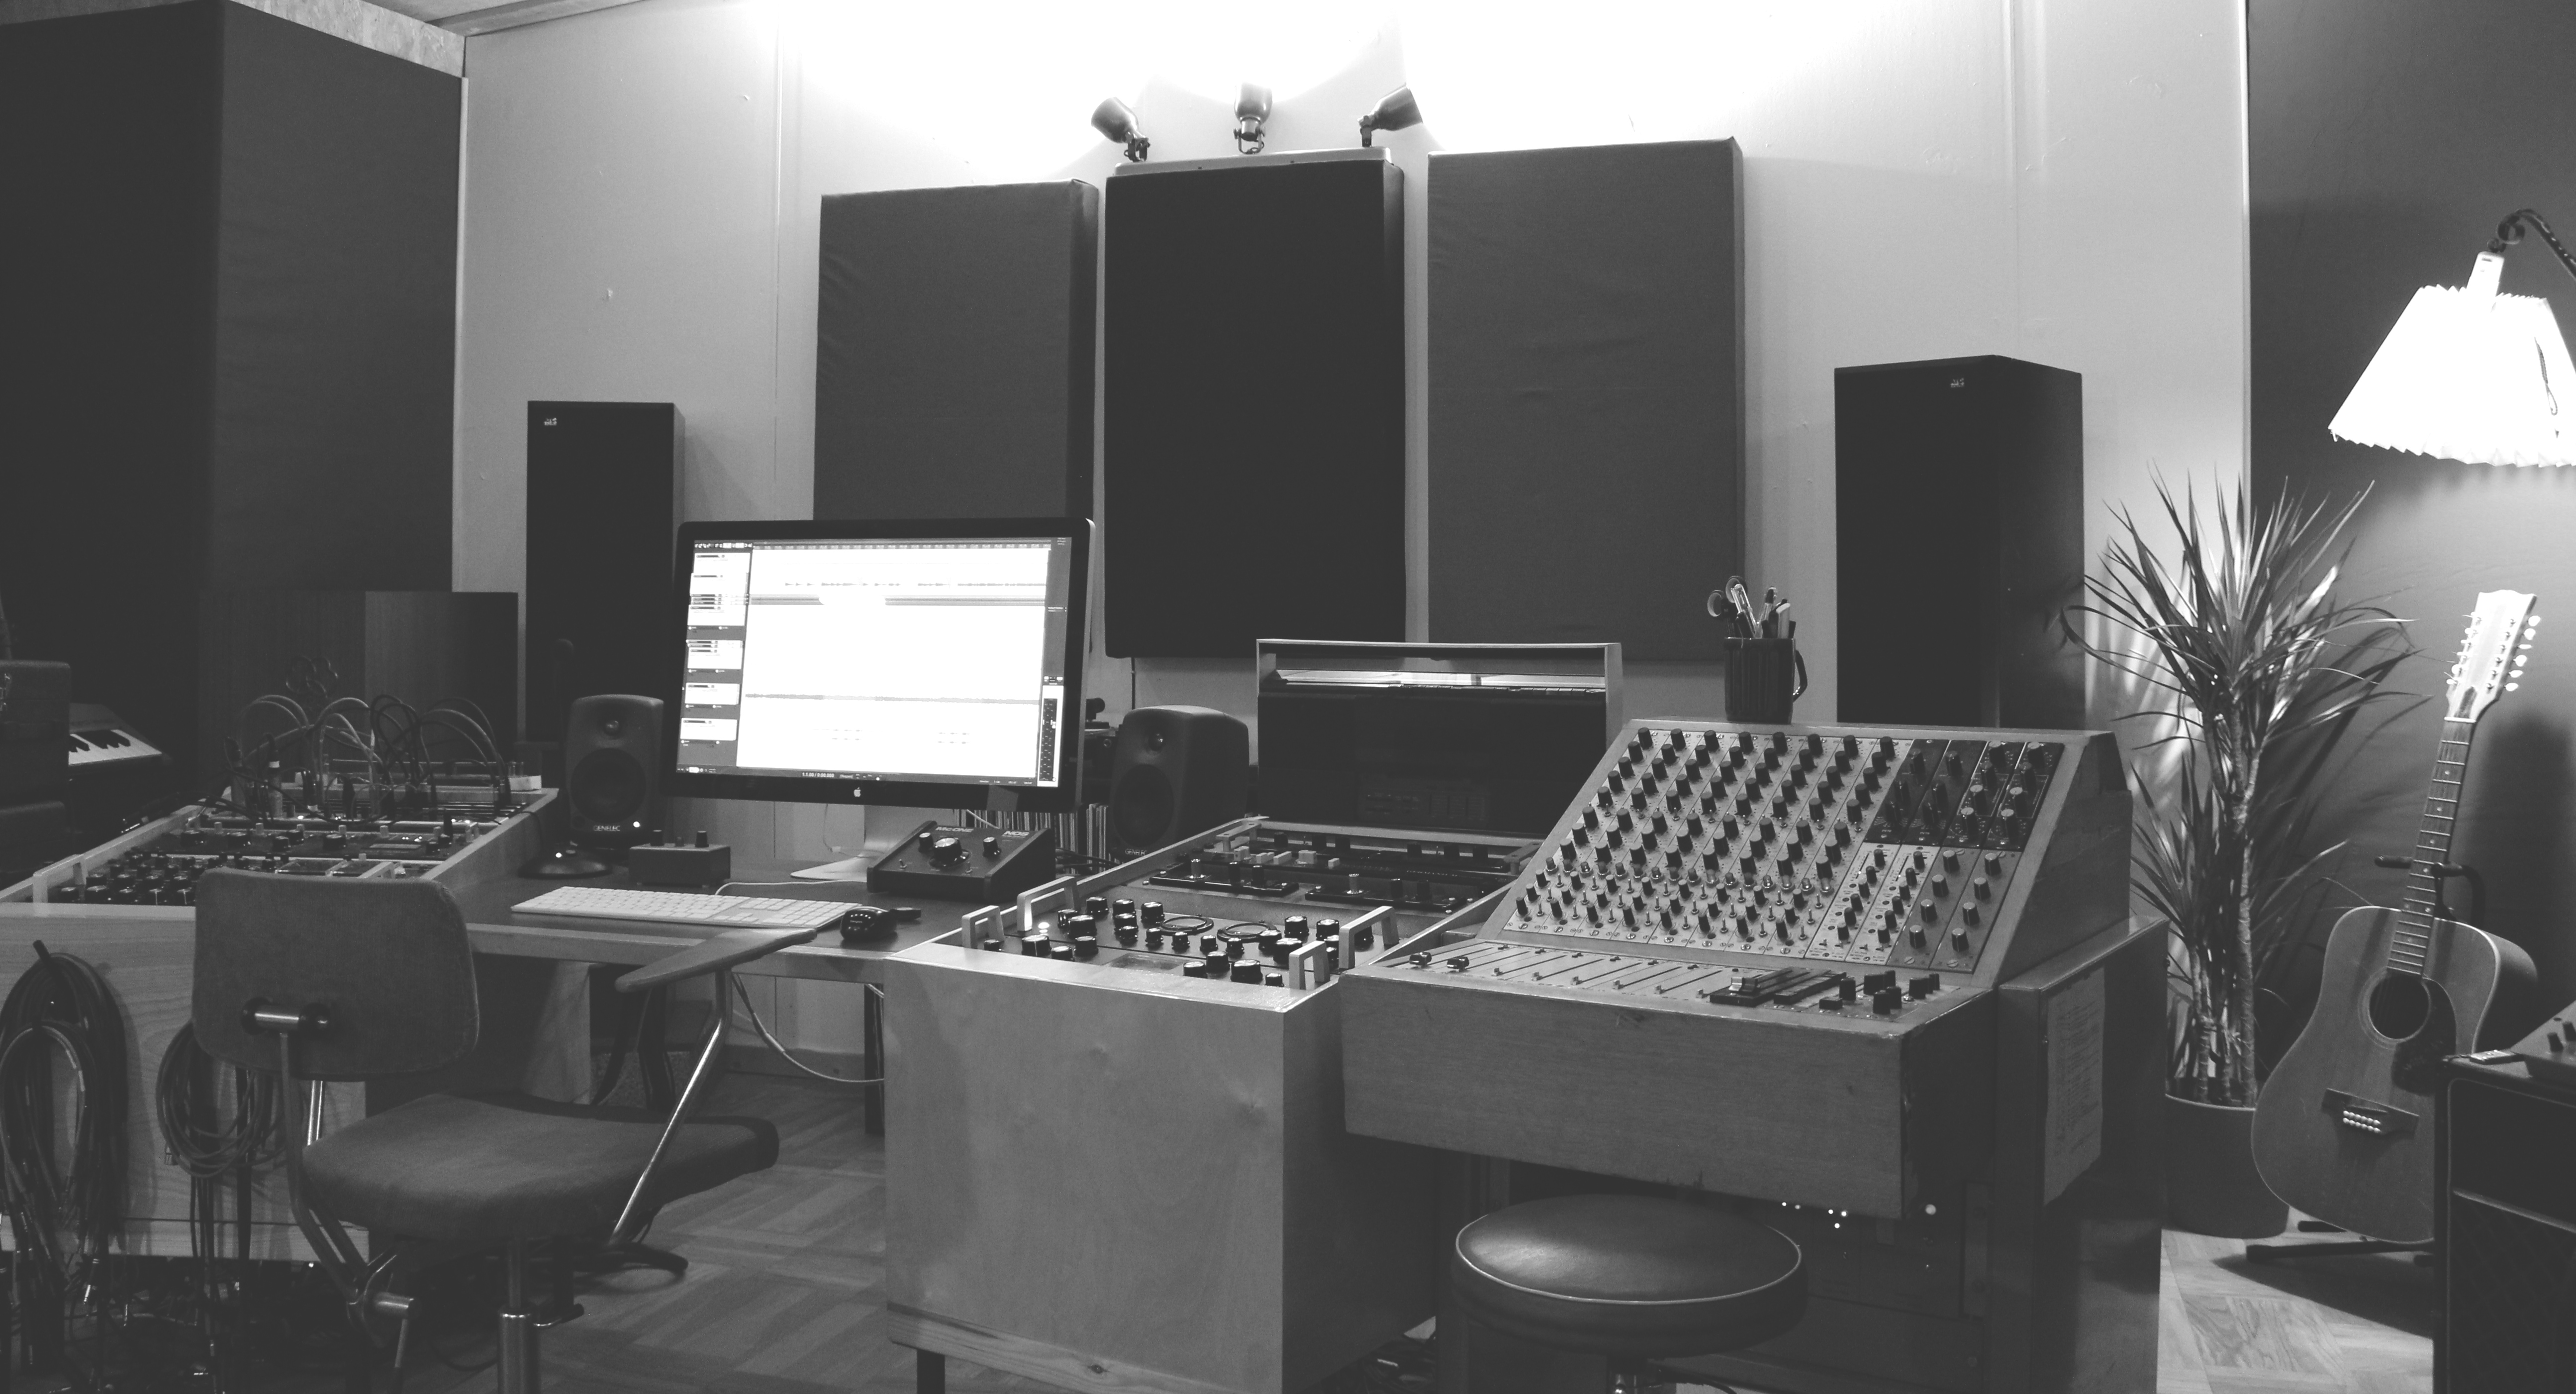
The studio has a large 33 m² control room and a 45 m² tracking room with isolated vocal booth, and is built around a hybrid digital/analog setup.
I record, produce and mix a variety of different artist in pop, rock, folk, alternative, indie, electronic and other genres, and specialize in organic, acoustic and 'played-by-hand' music.

